Motion, not just color
A stock up 10% or more in a day catches fire on its row. A stock down 10% or more freezes into ice. The effect runs live, so a big day reads the instant you open the app.
StockFloc is a stock watchlist you see instead of read. Every stock you follow shows its day as temperature: up 10% or more and the row catches fire, down 10% or more and it freezes into ice. It works like a live heat map of your own watchlist, free on iPhone and Android, with no brokerage account.
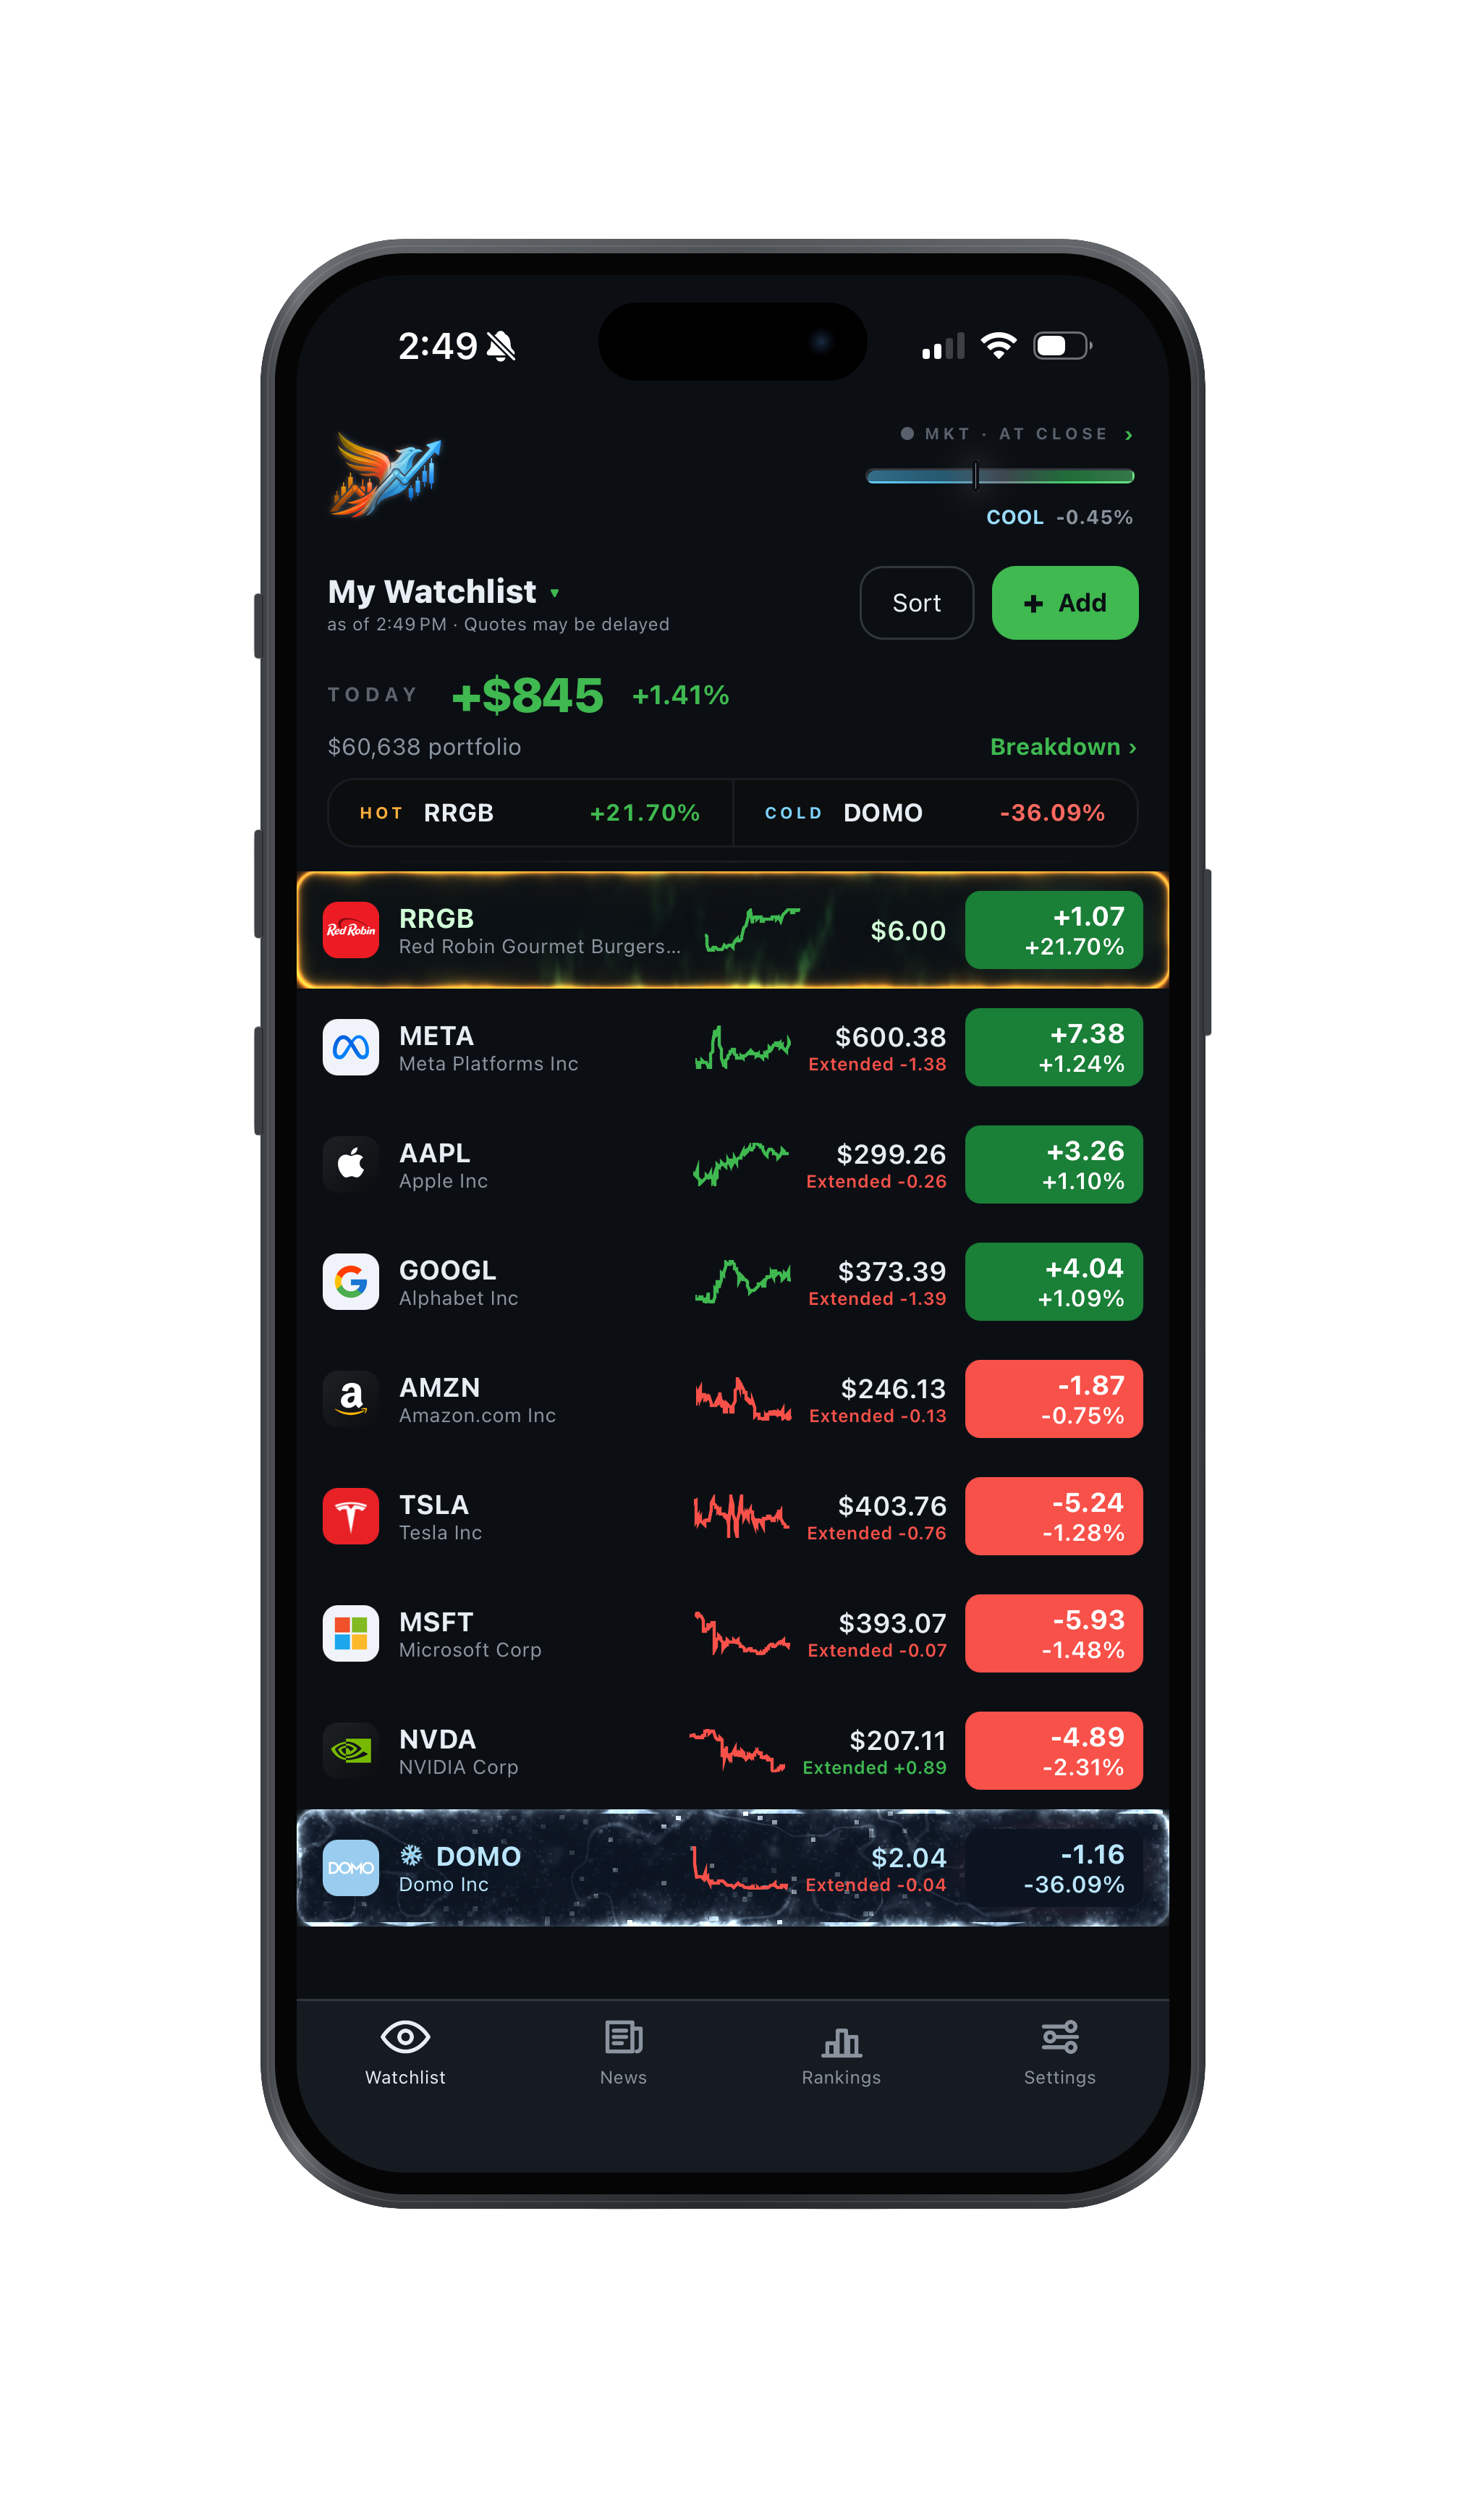
Your watchlist, not a grid of tiles. The two stocks that moved big are the two you see first.
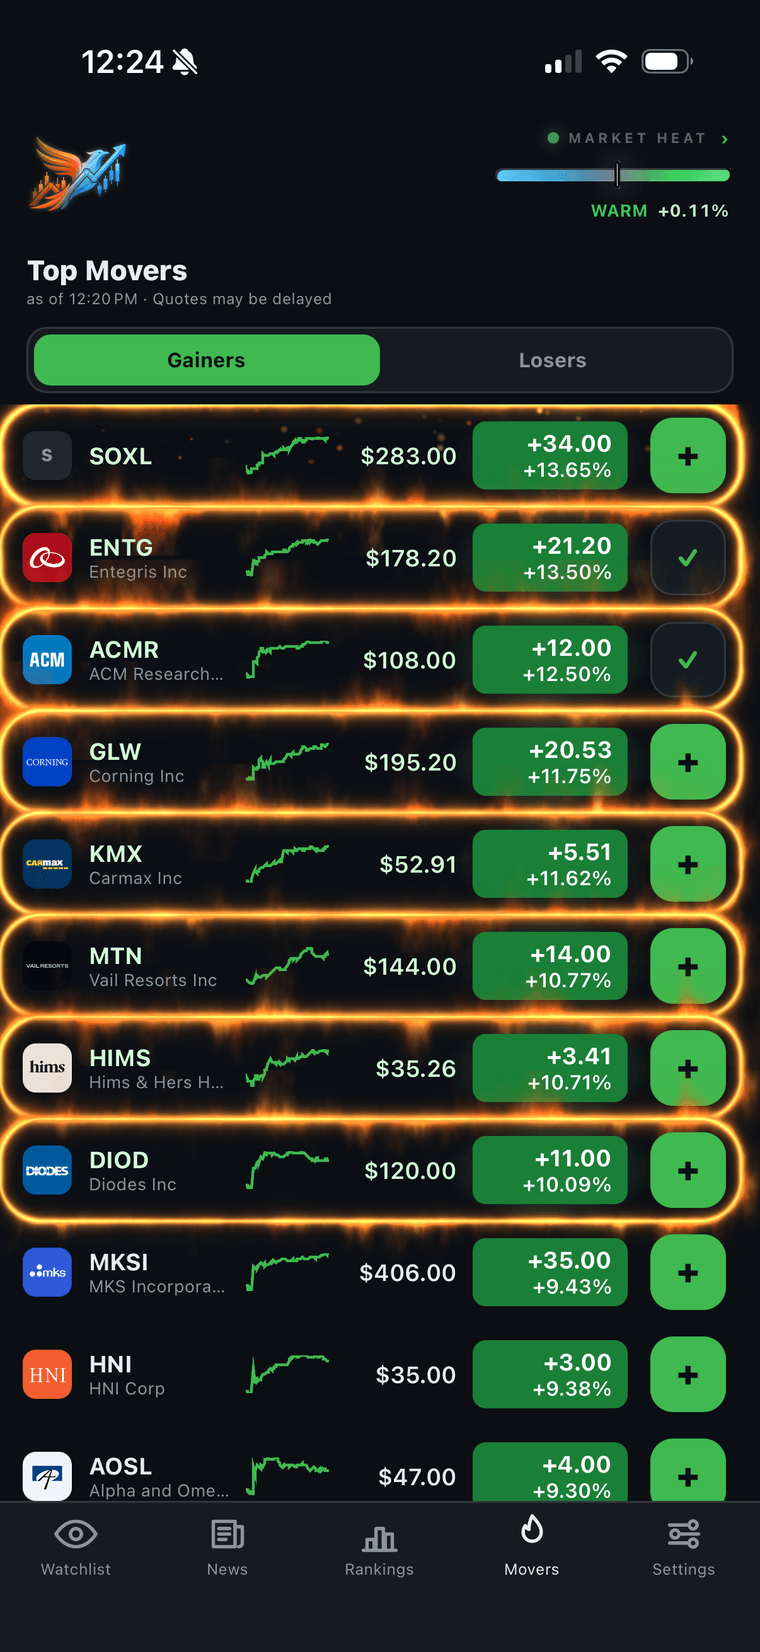
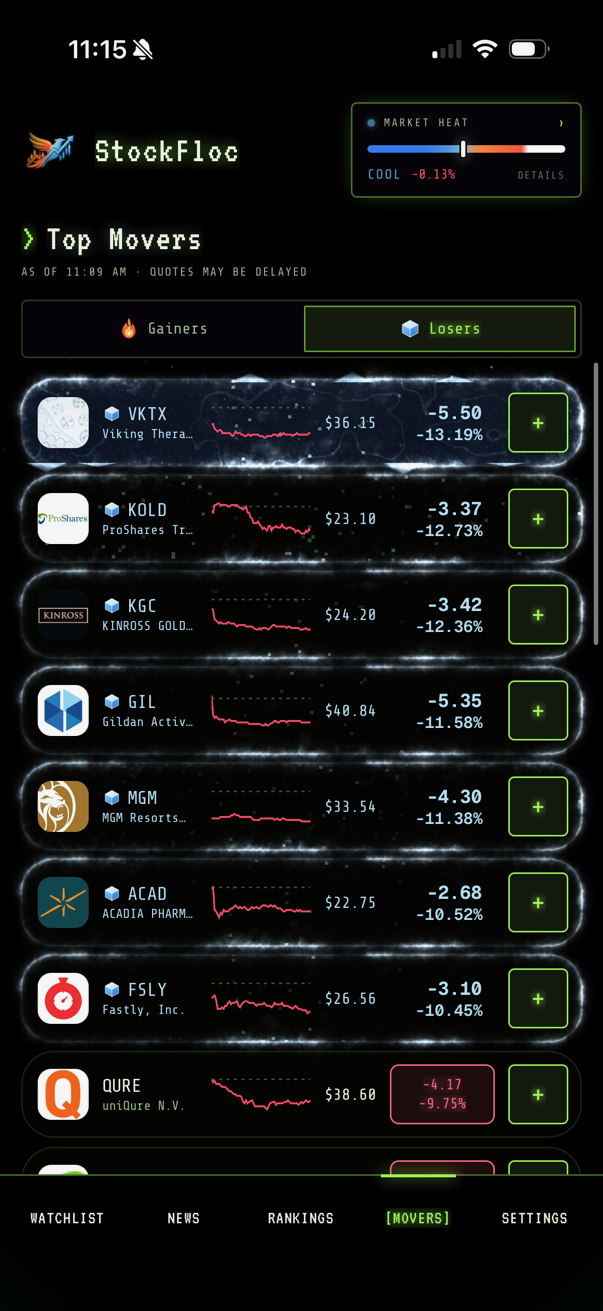
A stock up 10% or more in a day catches fire on its row. A stock down 10% or more freezes into ice. The effect runs live, so a big day reads the instant you open the app.
Heat comes from how far a stock moved, not how big the company is. A small cap up 25% is on fire, while a megacap up half a percent stays calm.
Moves under 10% stay calm, so the few rows that ignite actually stand out. You are not scanning a wall of colored tiles.
Each stock carries its company logo, so you can find a name by shape and color before you read the ticker.
Every row has an intraday sparkline drawn against a dashed line at the previous close. Above the line is a gain, below it is a loss.
A gauge in the header shows whether the whole market is running hot or cold today, with a full breakdown one tap away.
The clean Default look, or Retro: a glowing CRT terminal. Retro is free in Magenta, and Premium adds Amber, Green, and Blue.
On a stock's detail page, the 52-week range is drawn as an ice-to-fire temperature bar, so you see where today's price sits at a glance.
Classic stock heat maps, like the S&P 500 map on Finviz, are great for seeing the whole market. StockFloc answers a different question: how are my stocks doing right now?
| Static market heat map | StockFloc | |
|---|---|---|
| What it shows | A whole index or sector as a grid of tiles | The stocks on your own watchlist |
| What stands out | The biggest companies, since tiles are sized by market cap | The biggest moves: 10% or more in a day ignites |
| Motion | Static color | Live fire and ice animation at 10% or more |
| Quiet days | Every tile is tinted | Calm stocks stay calm; only big movers ignite |
| Best for | Seeing the whole market at once | Checking your own stocks many times a day |
A market heat map is the better tool for scanning every sector at once. StockFloc is the better tool for the stocks you actually own or follow. A good setup is a heat map on the desktop and StockFloc on your phone. See the full StockFloc vs Finviz comparison.
StockFloc is built to be the most visual stock watchlist. Instead of static red and green numbers, any stock that moves 10% or more in a day erupts into a live animation on its row: fire for big gains, ice for big losses. Rows also carry company logos and intraday sparklines, and a Market Heat gauge shows whether the market is running hot or cold. It is free on iPhone and Android with no brokerage account.
It is a heat map of your own watchlist rather than of an index. A classic stock heat map shows a grid of tiles sized by market cap. StockFloc keeps your stocks in a normal list and lights each row by the size of its move, so a small cap up 25% catches fire while a megacap up half a percent stays calm.
The visuals sit on top of real numbers. Every row still shows the price, the dollar change, and the percent change. Quotes come from a commercially licensed feed and may be delayed about 15 minutes. StockFloc is for watching and tracking, not for executing trades, and it is not investment advice.
StockFloc is free to download and use, with ads. One optional one-time $0.99 Premium unlock removes ads and adds perks like portfolio analytics, more watchlists, and every Retro theme glow. There is no subscription.